Ideally one want to query all data indexed in a Vespa cluster within the specified timeout,
but that might not be possible for different reasons:
The system might be overloaded due to capacity constraints,
and queries do not complete within the timeout,
as they are sitting in a queue waiting for a resource.
A complex query might take longer time to execute than the specified timeout,
or the timeout is too low given the complexity of the query and available resource capacity.
This document describes how Vespa could gracefully degrade the result set
if the query cannot be completed within the timeout specified.
Definitions:
Coverage: The percentage of documents indexed which were evaluated by the query.
The ideal coverage is 100%.
Timeout: The total time a query is allowed to run for,
see timeout (default 500 ms).
Vespa is a distributed system where multiple components are involved in the query execution.
Soft Timeout: Soft timeout allows coverage to be less than 100%,
but larger than 0% if the query is approaching timeout.
Soft timeout might also be considered as an early termination technique, and is enabled by default.
Refer to ranking.softtimeout.enable.
Detection
The default JSON renderer template will always render a coverage element below the root element,
which has a degraded element if the query execution was degraded in some way
and the coverage field will be less than 100.
Example request with a query timeout of 200 ms and ranking.softtimeout.enable=true:
/search/?searchChain=vespa&yql=select * from sources * where foo contains bar&presentation.format=json&timeout=200ms&ranking.softtimeout.enable=true
The result was delivered in 200 ms but the query was degraded as coverage is less than 100.
In this case, 167,006,201 out of x documents where queried, and 16,469,732 documents where matched and ranked,
using the first-phase ranking expression in the default rank profile.
The degraded field contains the following fields which explains why the result had coverage less than 100:
adaptive-timeout is true if adaptive node timeout
has been enabled, and one or more nodes fail to produce a result at all within the timeout.
This could be caused by nodes with degraded hardware making them slower than peers in the cluster.
match-phase is true if the rank profile has defined
match phase ranking degradation.
Match-phase can be used to control which documents are ranked within the timeout.
non-ideal-state is true in cases where the system is not in
ideal state. This case is extremely rare.
timeout is true if softtimeout was enabled, and not all documents could be matched and ranked
within the query timeout.
Note that the degraded reasons are not mutually exclusive.
In the example, the softtimeout was triggered
and only 99% of the documents where queried before the time budget ran out.
One could imagine scenarios where 10 out of 11 nodes involved in the query execution were healthy
and triggered soft timeout and delivered a result,
while the last node was in a bad state (e.g. hw issues) and could not produce a result at all,
and that would cause both timeout and adaptive-timeout to be true.
When working on Results in a Searcher,
get the coverage information programmatically:
@OverridepublicResultsearch(Queryquery,Executionexecution){Resultresult=execution.search(query);Coveragecoverage=result.getCoverage(false);if(coverage!=null&&coverage.isDegraded()){logger.warning("Got a degraded result for query "+query+" : "+coverage.getResultPercentage()+"% was searched");}returnresult;}
Adaptive node timeout
For a content cluster with flat
data distribution, query performance is no better than the slowest node. The worst case scenario happens
when a node in the cluster is experiencing underlying HW issues. In such a state,
a node might answer health checks and pings, but still not be able to serve queries within the timeout.
Using adaptive coverage allows ignoring slow node(s).
The following example demonstrates how to use adaptive timeout.
The example uses a flat content cluster with 10 nodes:
Assuming using the default vespa timeout of 500ms, the stateless container dispatches the query
to all 10 nodes in parallel and waits until 9 out of 10 have replied (minimum coverage 0.9).
Assuming 9 could respond in 100ms, there is 400ms left. The dispatcher then waits minimum 80 ms (0.2*400ms) for the last
node to respond, and at maximum 120 (0.3*400ms) before giving up waiting for the slowest node and return the result.
The min wait setting is used to allow some per node response time variance.
Using min wait 0 will cause the query to return immediately when min coverage has been reached
(9 out of 10 nodes replied).
A higher than 0 value for min allows a node to be slightly slower than the
peers and overall still reach 100% coverage.
Match-phase works by specifying an attribute that measures document
quality in some way (popularity, click-through rate, pagerank, ad bid value, price, text quality).
In addition, a max-hits value is specified
that specifies how many hits are "more than enough" for the application.
Then an estimate is made after collecting a reasonable amount of hits for the query,
and if the estimate is higher than the configured max-hits value,
an extra limitation is added to the query,
ensuring that only the highest quality documents can become hits.
In effect, this limits the documents actually queried to the highest quality documents,
a subset of the full corpus,
where the size of subset is calculated in such a way
that the query is estimated to give max-hits hits.
Since some (low-quality) hits will already have been collected to do the estimation,
the actual number of hits returned will usually be higher than max-hits.
But since the distribution of documents isn't perfectly smooth,
you risk sometimes getting less than the configured max-hits hits back.
Note that limiting hits in the match-phase also affects aggregation/grouping,
and total-hit-count since it actually limits, so the query gets fewer hits.
Also note that it doesn't really make sense to use this
feature together with a WAND operator that also limit hits,
since they both operate in the same manner,
and you would get interference between them that could cause unpredictable results.
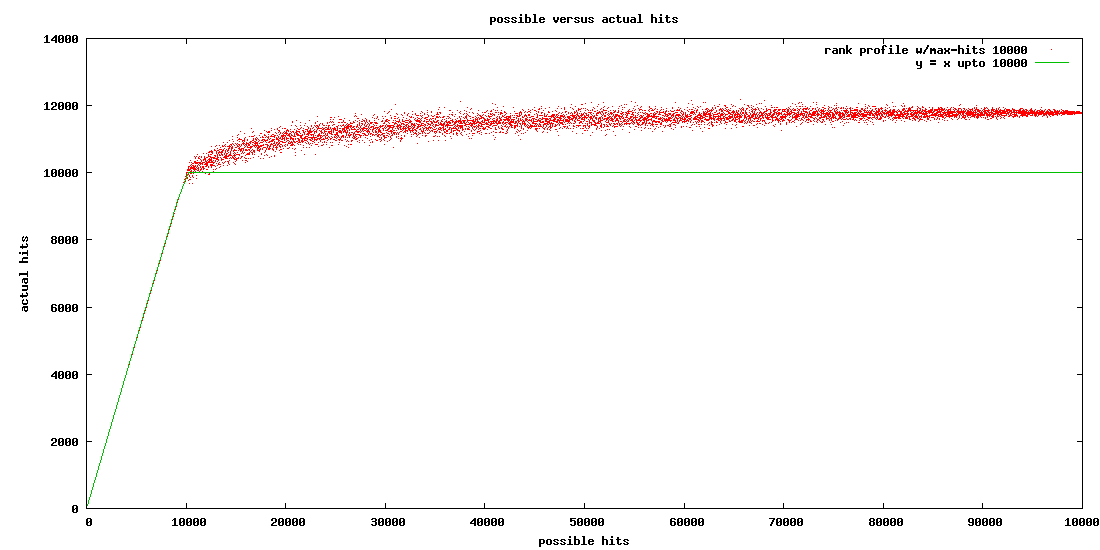
The graph shows possible hits versus actual hits in a corpus with 100 000 documents,
where max-hits is configured to 10 000.
The corpus is a synthetic (slightly randomized) data set,
in practice the graph will be less smooth:
There is a content node metric per rank-profile named
content.proton.documentdb.matching.rank_profile.limited_queries
which can be used to see how many of the queries are actually affected by these settings;
compare with the corresponding content.proton.documentdb.matching.rank_profile.queries metric
to measure the percentage.
Match Phase Tradeoffs
There are some important things to consider before using match-phase.
In a normal query scenario, latency is directly proportional to the number of hits the query matches:
a query that matches few documents will have low latency
and a query that matches many documents will have high latency.
Match-phase has the opposite effect.
This means that if you have queries that match few documents,
match-phase might make these queries significantly slower.
It might actually be faster to run the query without the filter.
Example: Lets say you have a corpus with a document attribute named created_time.
For all queries you want the newest content surfaced, so you enable match-phase on created_time.
So far, so good - you get a great latency and always get your top-k hits.
The problem might come if you introduce a filter.
If you have a filter saying you only want documents from the last day,
then match-phase can become suboptimal and in some cases much worse than running without match-phase.
By design, Vespa will evaluate potential matches for a query by the order of their internal documentid.
This means it will start evaluating documents in the order they were indexed on the node,
and for most use-cases that means the oldest documents first.
Without a filter, every document is a potential match,
and match-phase will quickly figure out how it can optimize.
With the filter, on the other hand, the algorithm need to evaluate almost the full corpus
before it reaches potential matches (1 day old corpus),
and because of the way the algorithm is implemented,
end up with doing a lot of unnecessary work and can have orders of magnitude higher latencies
than running the query without the filter.
Another important thing to mention is that the reported total-hits will be different
when doing queries with match-phase enabled.
This is because match-phase works on an estimated "virtual" corpus,
which might have much fewer hits than is actually in the full corpus.
If used correctly match-phase can be a life-saver, however,
it is not a straight forward fix-it-all silver bullet.
Please test and measure your use of match-phase,
and contact the Vespa team if your results are not what you expect.