-
Applications and components
- Developer guide
- IDE support
- Deployment
- .vespaignore files
- Containers
- Components
- Searchers
- Document processors
- Request handlers
- Result renderers
- Dependency injection
- Configuring components
- Chaining
- Inspecting structured data in a Searcher
- Developing web services
- Unit testing
- System testing
- The config system
- Request-response processing
- Bundles
- Using ZooKeeper
- Http servers and filters
- Using pluggable frameworks
- Java config API
-
Querying
- The query api
- The YQL query language
- Grouping and aggregation
- Federation
- Query profiles
- An intro to vector search
- Nearest neighbor search
- Approximate nearest neighbor search
- Nearest neighbor search guide
- Text matching
- Searching multivalue fields
- Geo search
- Document summaries
- Result diversity
- Page templates
-
Ranking and inference
- Ranking introduction
- Ranking expressions and features
- Multivalue query operators
- Tensor user guide
- Tensor examples
- Phased ranking
- Using TensorFlow models
- Using ONNX models
- Using XGBoost models
- Using LightGBM models
- Wand: Accelerated OR search
- The BM25 rank feature
- The nativeRank rank feature
- Cross-encoder transformer ranking
- Searcher re-ranking
- Significance model
- Stateless model evaluation
-
Linguistics and text processing
-
Content and elasticity
-
Performance
- Performance overview
- Practical performance guide
- Serving sizing guide
- Feed sizing guide
- Node resources
-
Instance types
- Topology and resizing
- Streaming search
- Benchmarking
- Benchmarking using Vespa Cloud
- Memory visualizer
- Profiling
- Container tuning
- Rate-limiting queries
- Graceful degradation
- Caches
- HTTP performance testing
- HTTP/2
- Feature tuning
- Valgrind
-
Operations
- Quota
- Environments
- Zones
- Availability Zones
- Production deployment
- Deployment variants
- Automated deployments
- Autoscaling
-
Enclave: Bring your own cloud
- Reindexing
- Reindexing on Vespa Cloud
- Data management and backup
- Cloning applications and data
- Monitoring
- Metrics
- Telemetry export
- Notifications
- Support
- Login Help
- Single Sign-On (SSO) Setup
- Deployment patterns
- Private endpoints
- Endpoint routing
- Access logging
-
Artifact archive
- Deleting applications
-
Self-managed
- Admin procedures
- Multinode Systems
- Files, Processes, Ports, Environment
- Node Setup
- Using Kubernetes
- Build and install
- Monitoring
- Content node recovery
- Configuration Servers
- Live Vespa upgrade procedure
- Config Sentinel
- Config Proxy
- Docker Containers
- Docker Containers GPU setup
- CPU Support
- Service Location Broker
- Change from attribute to index procedure
- Container
- Sizing examples
- Vespa Support CLI
-
Kubernetes
-
Modules
-
Reference
-
Applications and components
-
Schemas and documents
-
Reading and writing
-
Operations
- Health checks
- Log files
- Tools
-
Self-managed
-
Security
-
Release notes
When the indexing pipeline of an application changes, Vespa may need to reindex stored data so the index reflects the new specification. On Vespa Cloud this is handled for you: reindexing is enabled and started automatically as part of your deployment, and you can follow, pause, resume, re-trigger, and tune it from the Vespa Cloud console. There is no need to call the reindex endpoint and redeploy manually as you would in a self-managed deployment.
This page describes the Vespa Cloud workflow. See Reindexing for the underlying concepts, reindexing states, and schema-change use cases that apply to all deployments.
How reindexing is triggered
When you deploy a change that requires reindexing (see changes that require reindexing for the full list), Vespa Cloud enables and starts reindexing automatically once the deployment has converged on the new configuration. This replaces the manual procedure in a self-managed deployment, where reindexing is enabled through the reindex endpoint and started with another redeployment.
Only the stored document fields are re-fed; all derived fields are recomputed. Reindexing runs in the background, but how much it affects the cluster depends on the available resources and the current load. You control this trade-off with the reindexing speed: a lower speed uses fewer resources and has less impact on concurrent feed and queries, while a higher speed completes sooner at the cost of higher load. Until reindexing completes, affected fields may be empty or carry annotations that do not match the new configuration.
Controlling reindexing from the console
Reindexing is managed per content cluster from the Clusters view of a deployment in the Vespa Cloud console. Each content cluster lists its document types with the current reindexing state, speed, progress, and start and end times.
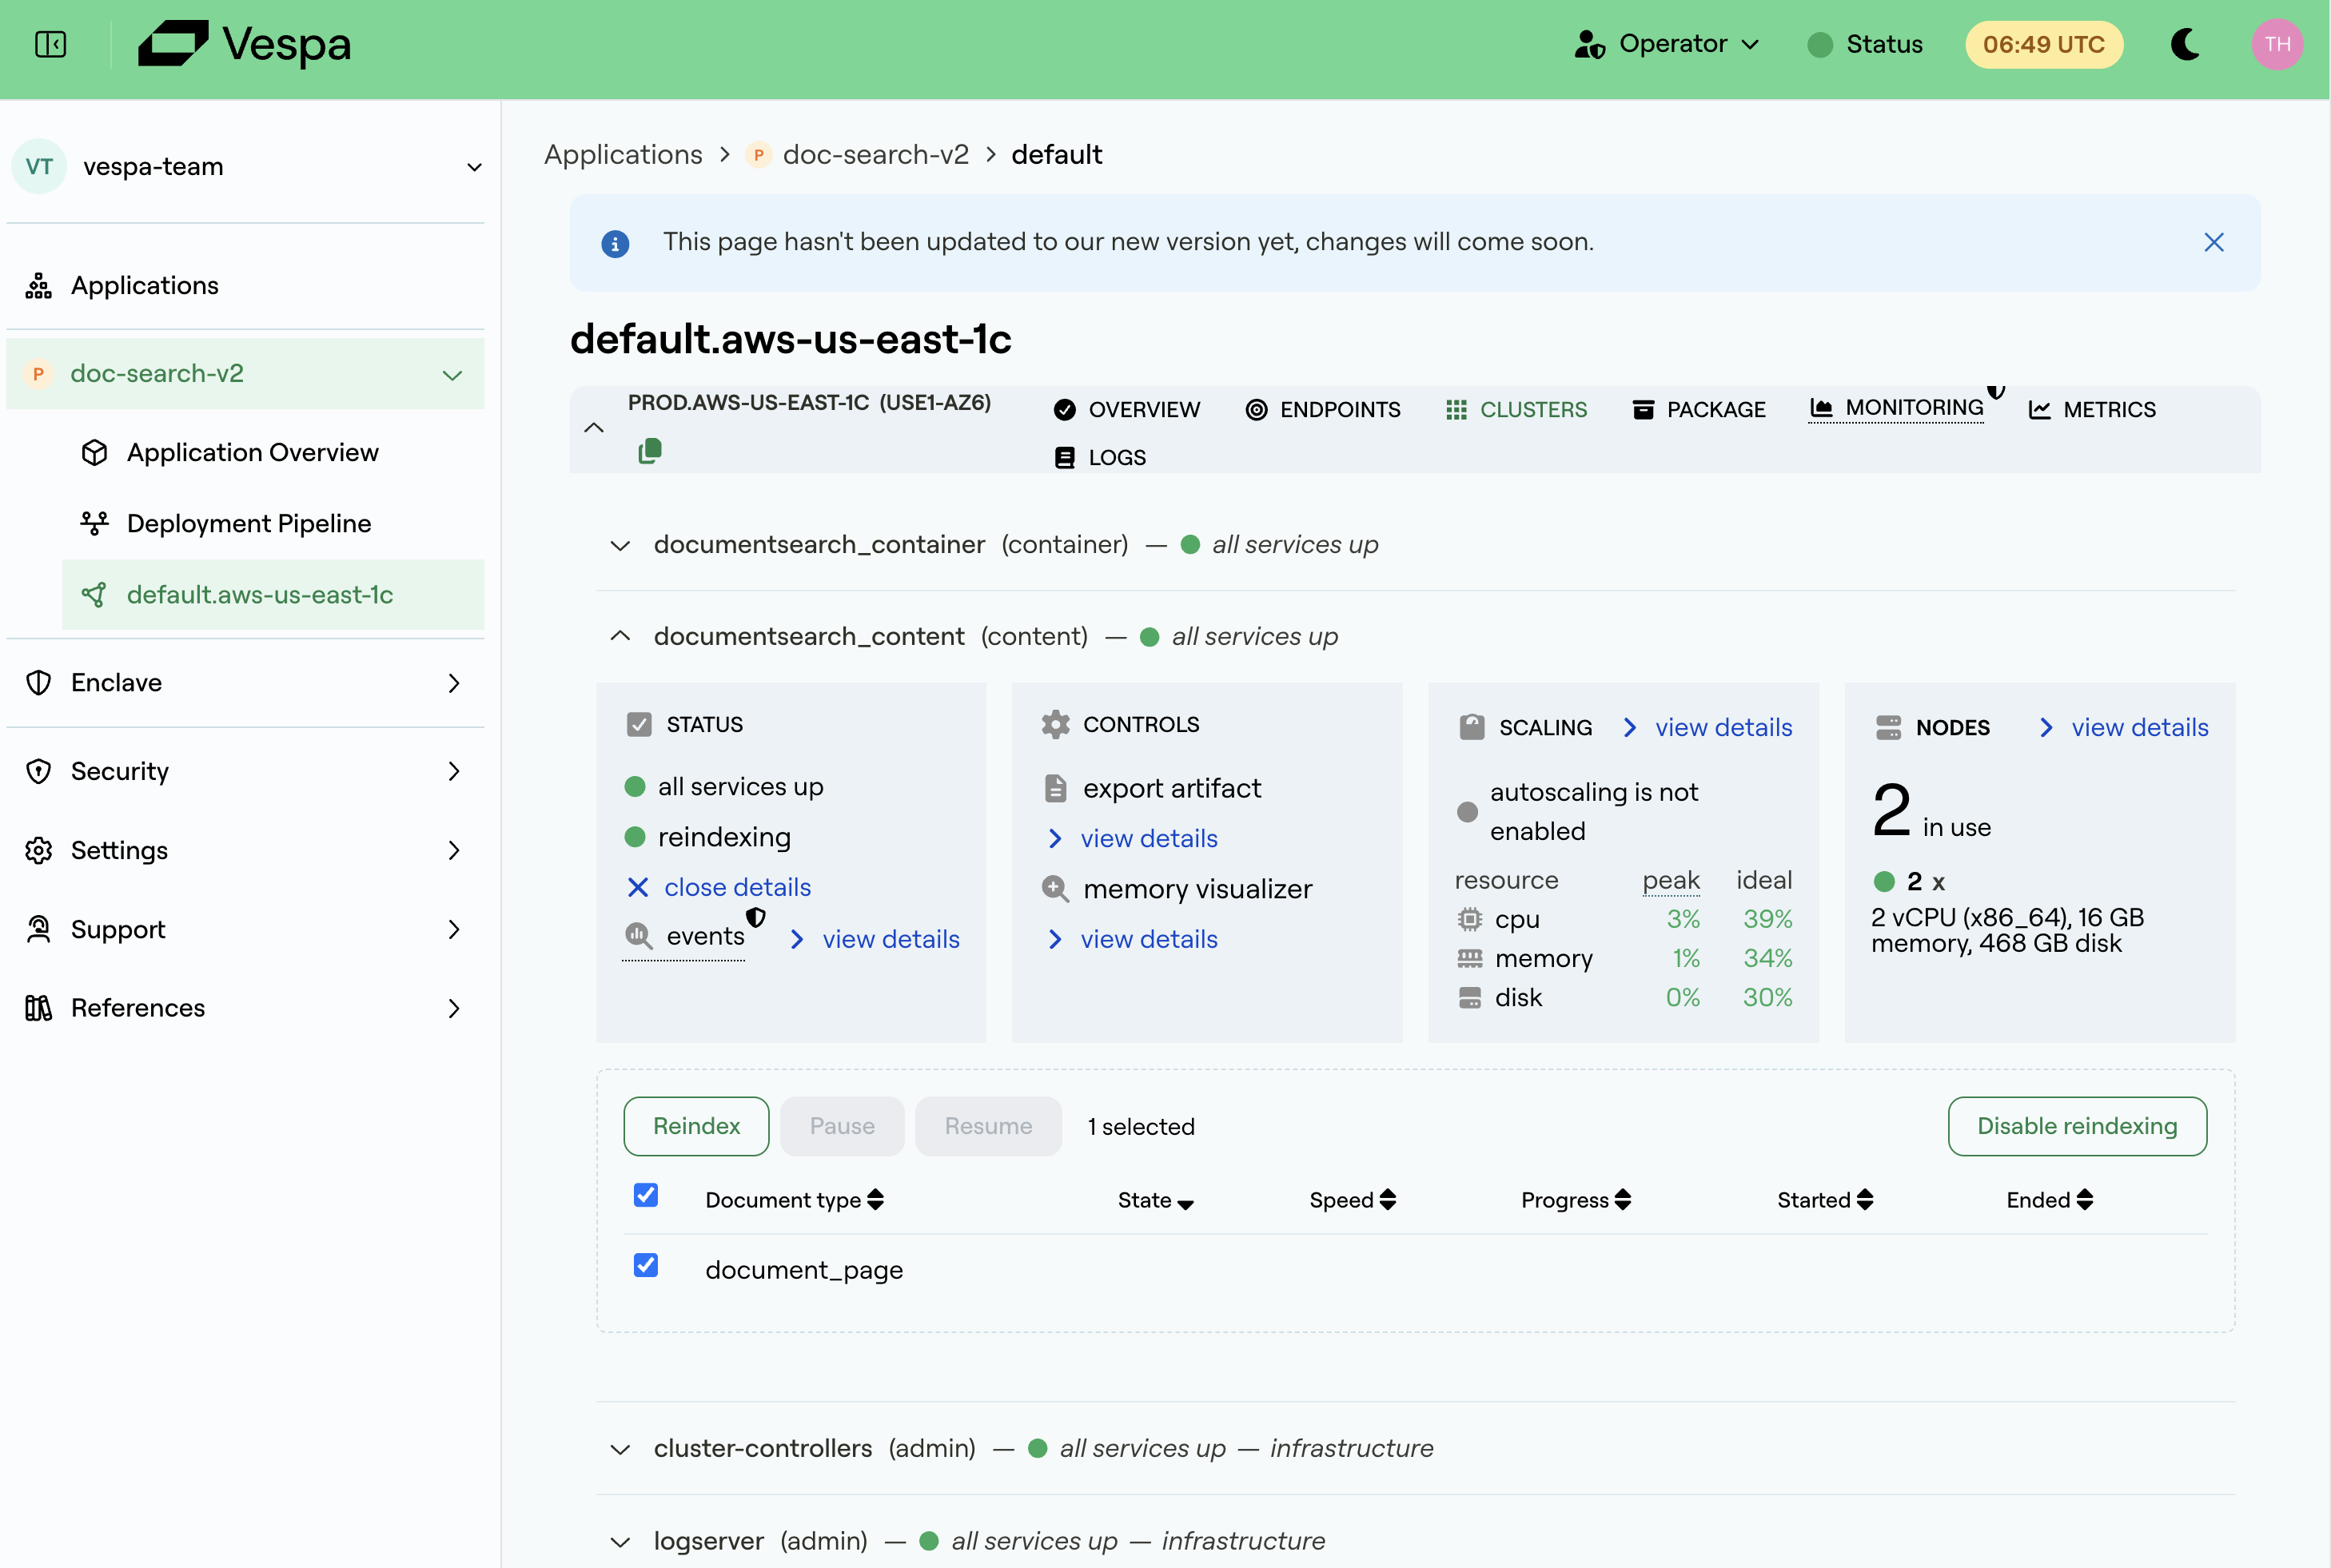
Select one or more document types to:
- Reindex: trigger a fresh reindexing, for example after deploying a document processor that transforms data, or to re-run an earlier reindexing.
- Pause and Resume: temporarily halt an ongoing reindexing, and resume it later from where it stopped.
- Disable reindexing: stop reindexing for the selected document types.
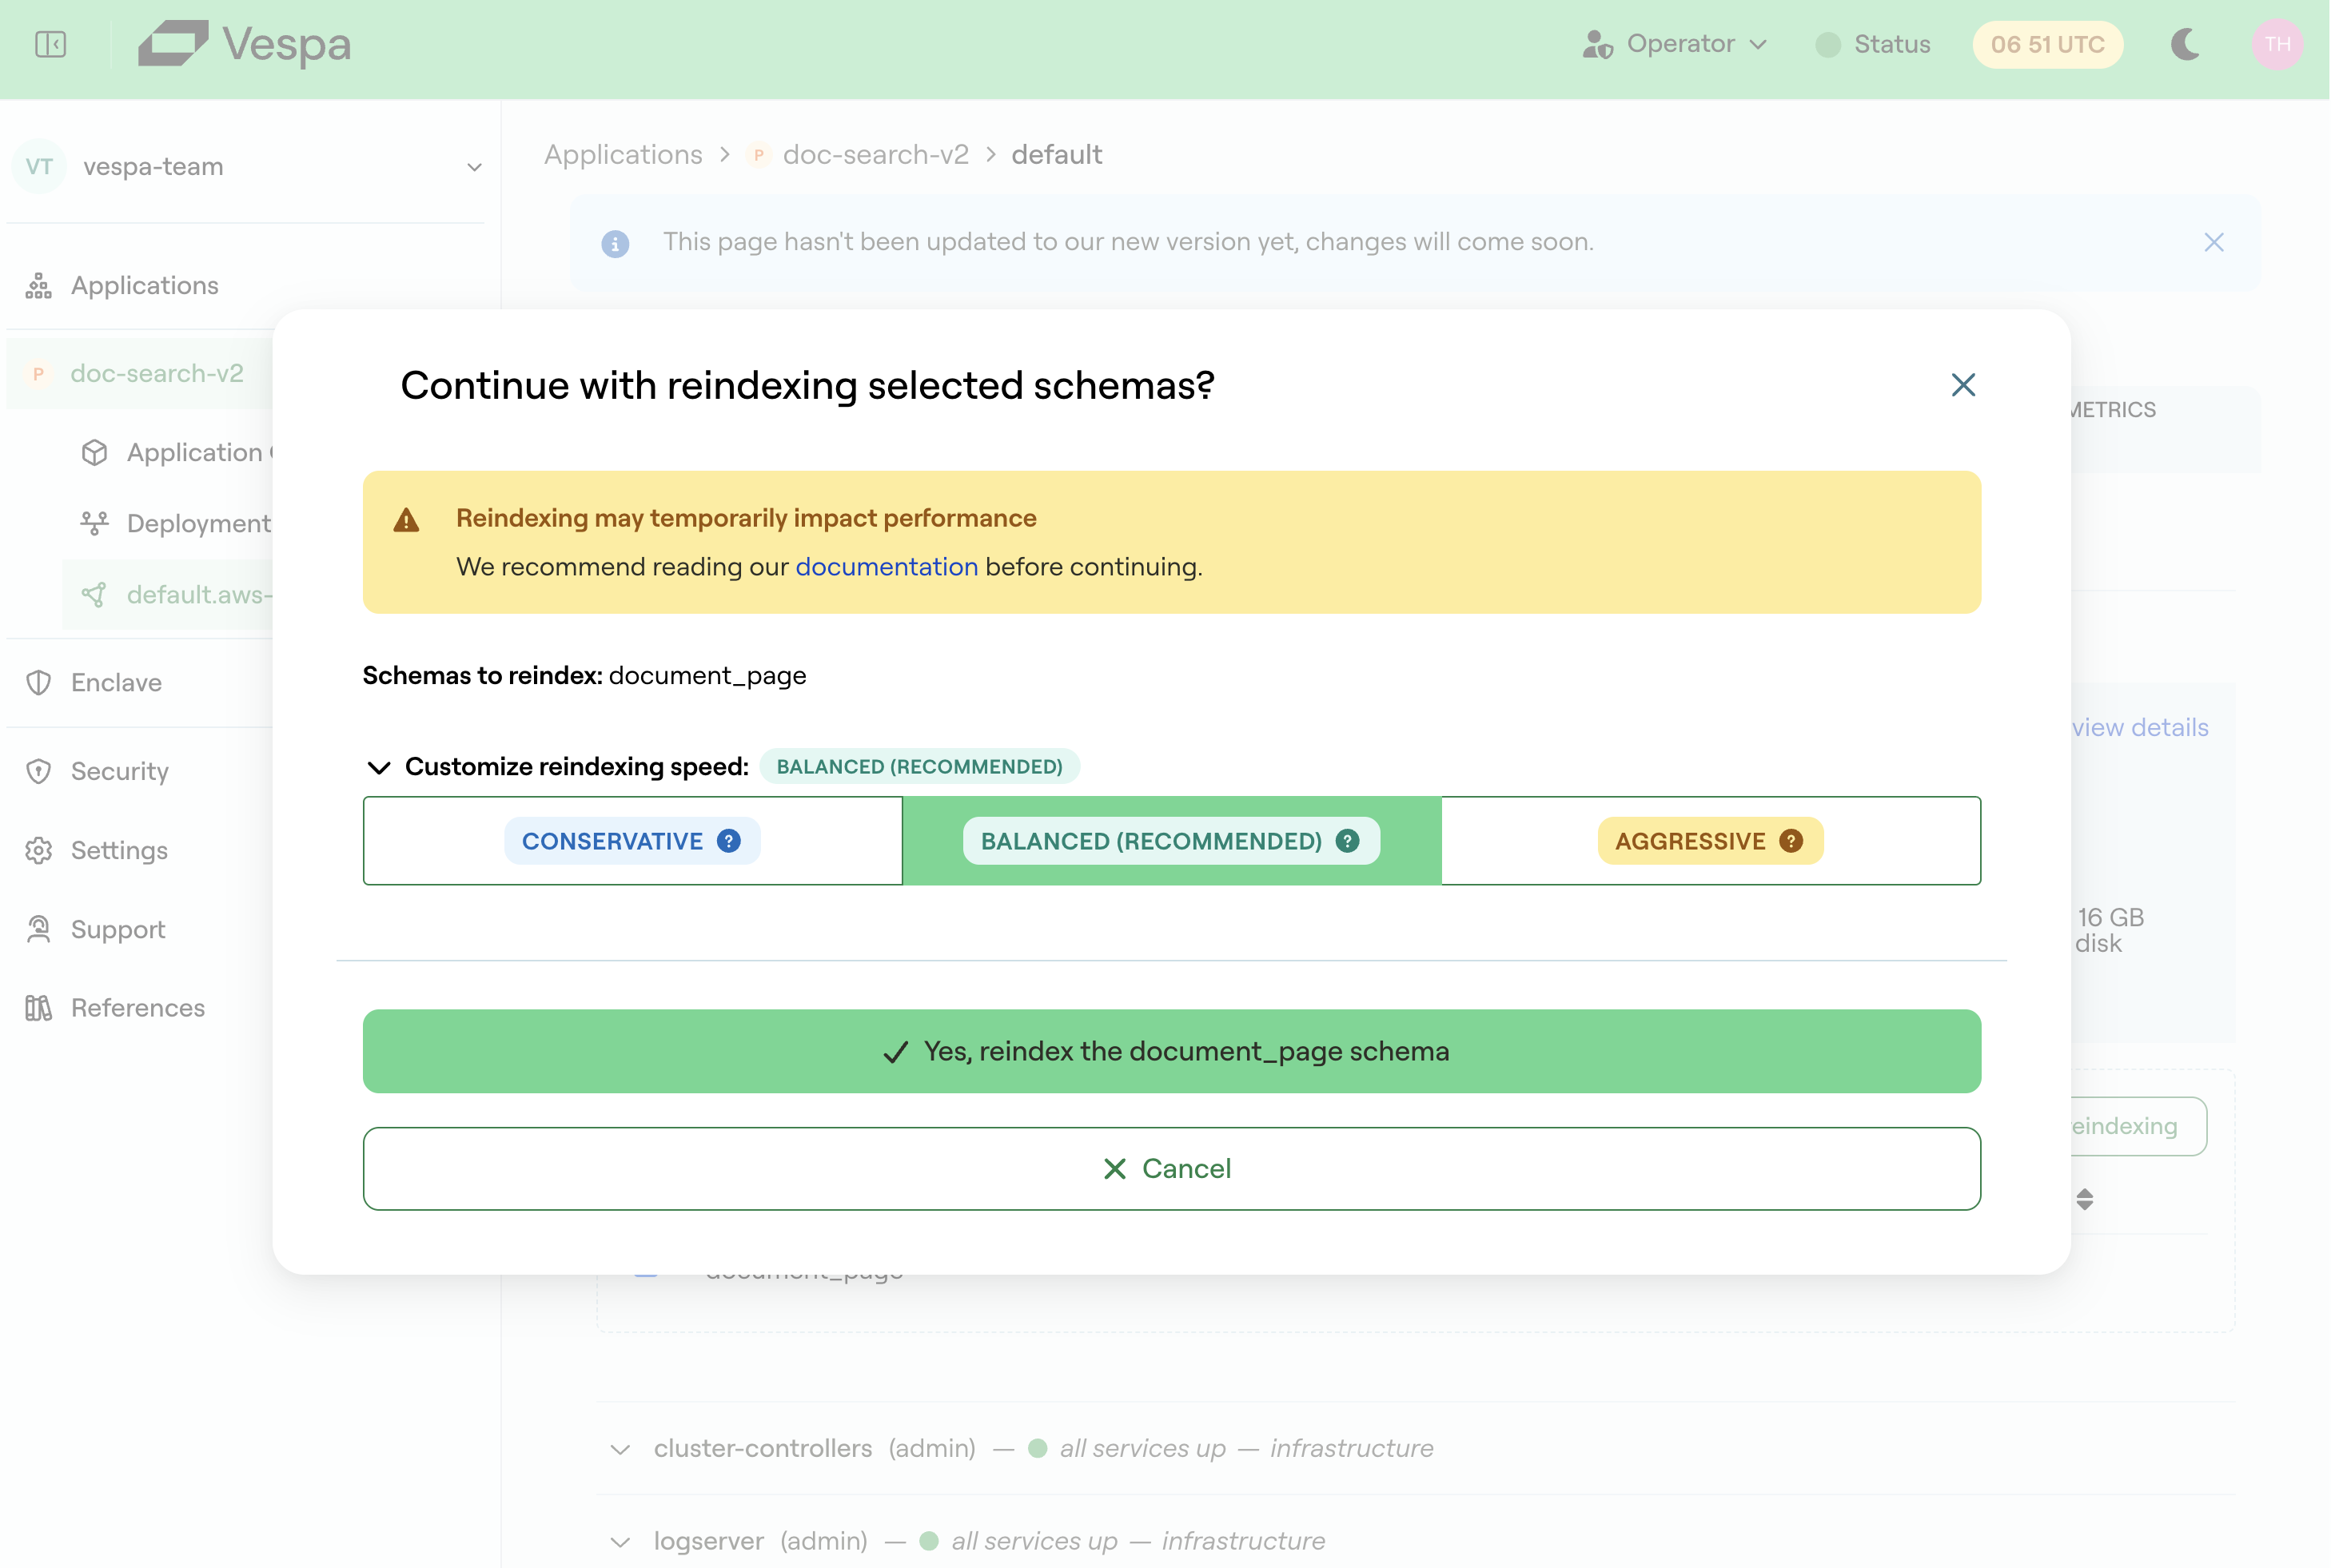
When you trigger reindexing, a dialog lets you choose the reindexing speed: Conservative, Balanced (the recommended default), or Aggressive. The speed balances time to completion against resource usage: a more aggressive speed completes reindexing sooner but consumes more of the cluster's resources, while a more conservative speed reduces the impact on concurrent feed and queries.
Monitoring progress
The Clusters view shows live progress for each document type: the state (pending, running, successful, or failed), a completion percentage, and the start and end times.
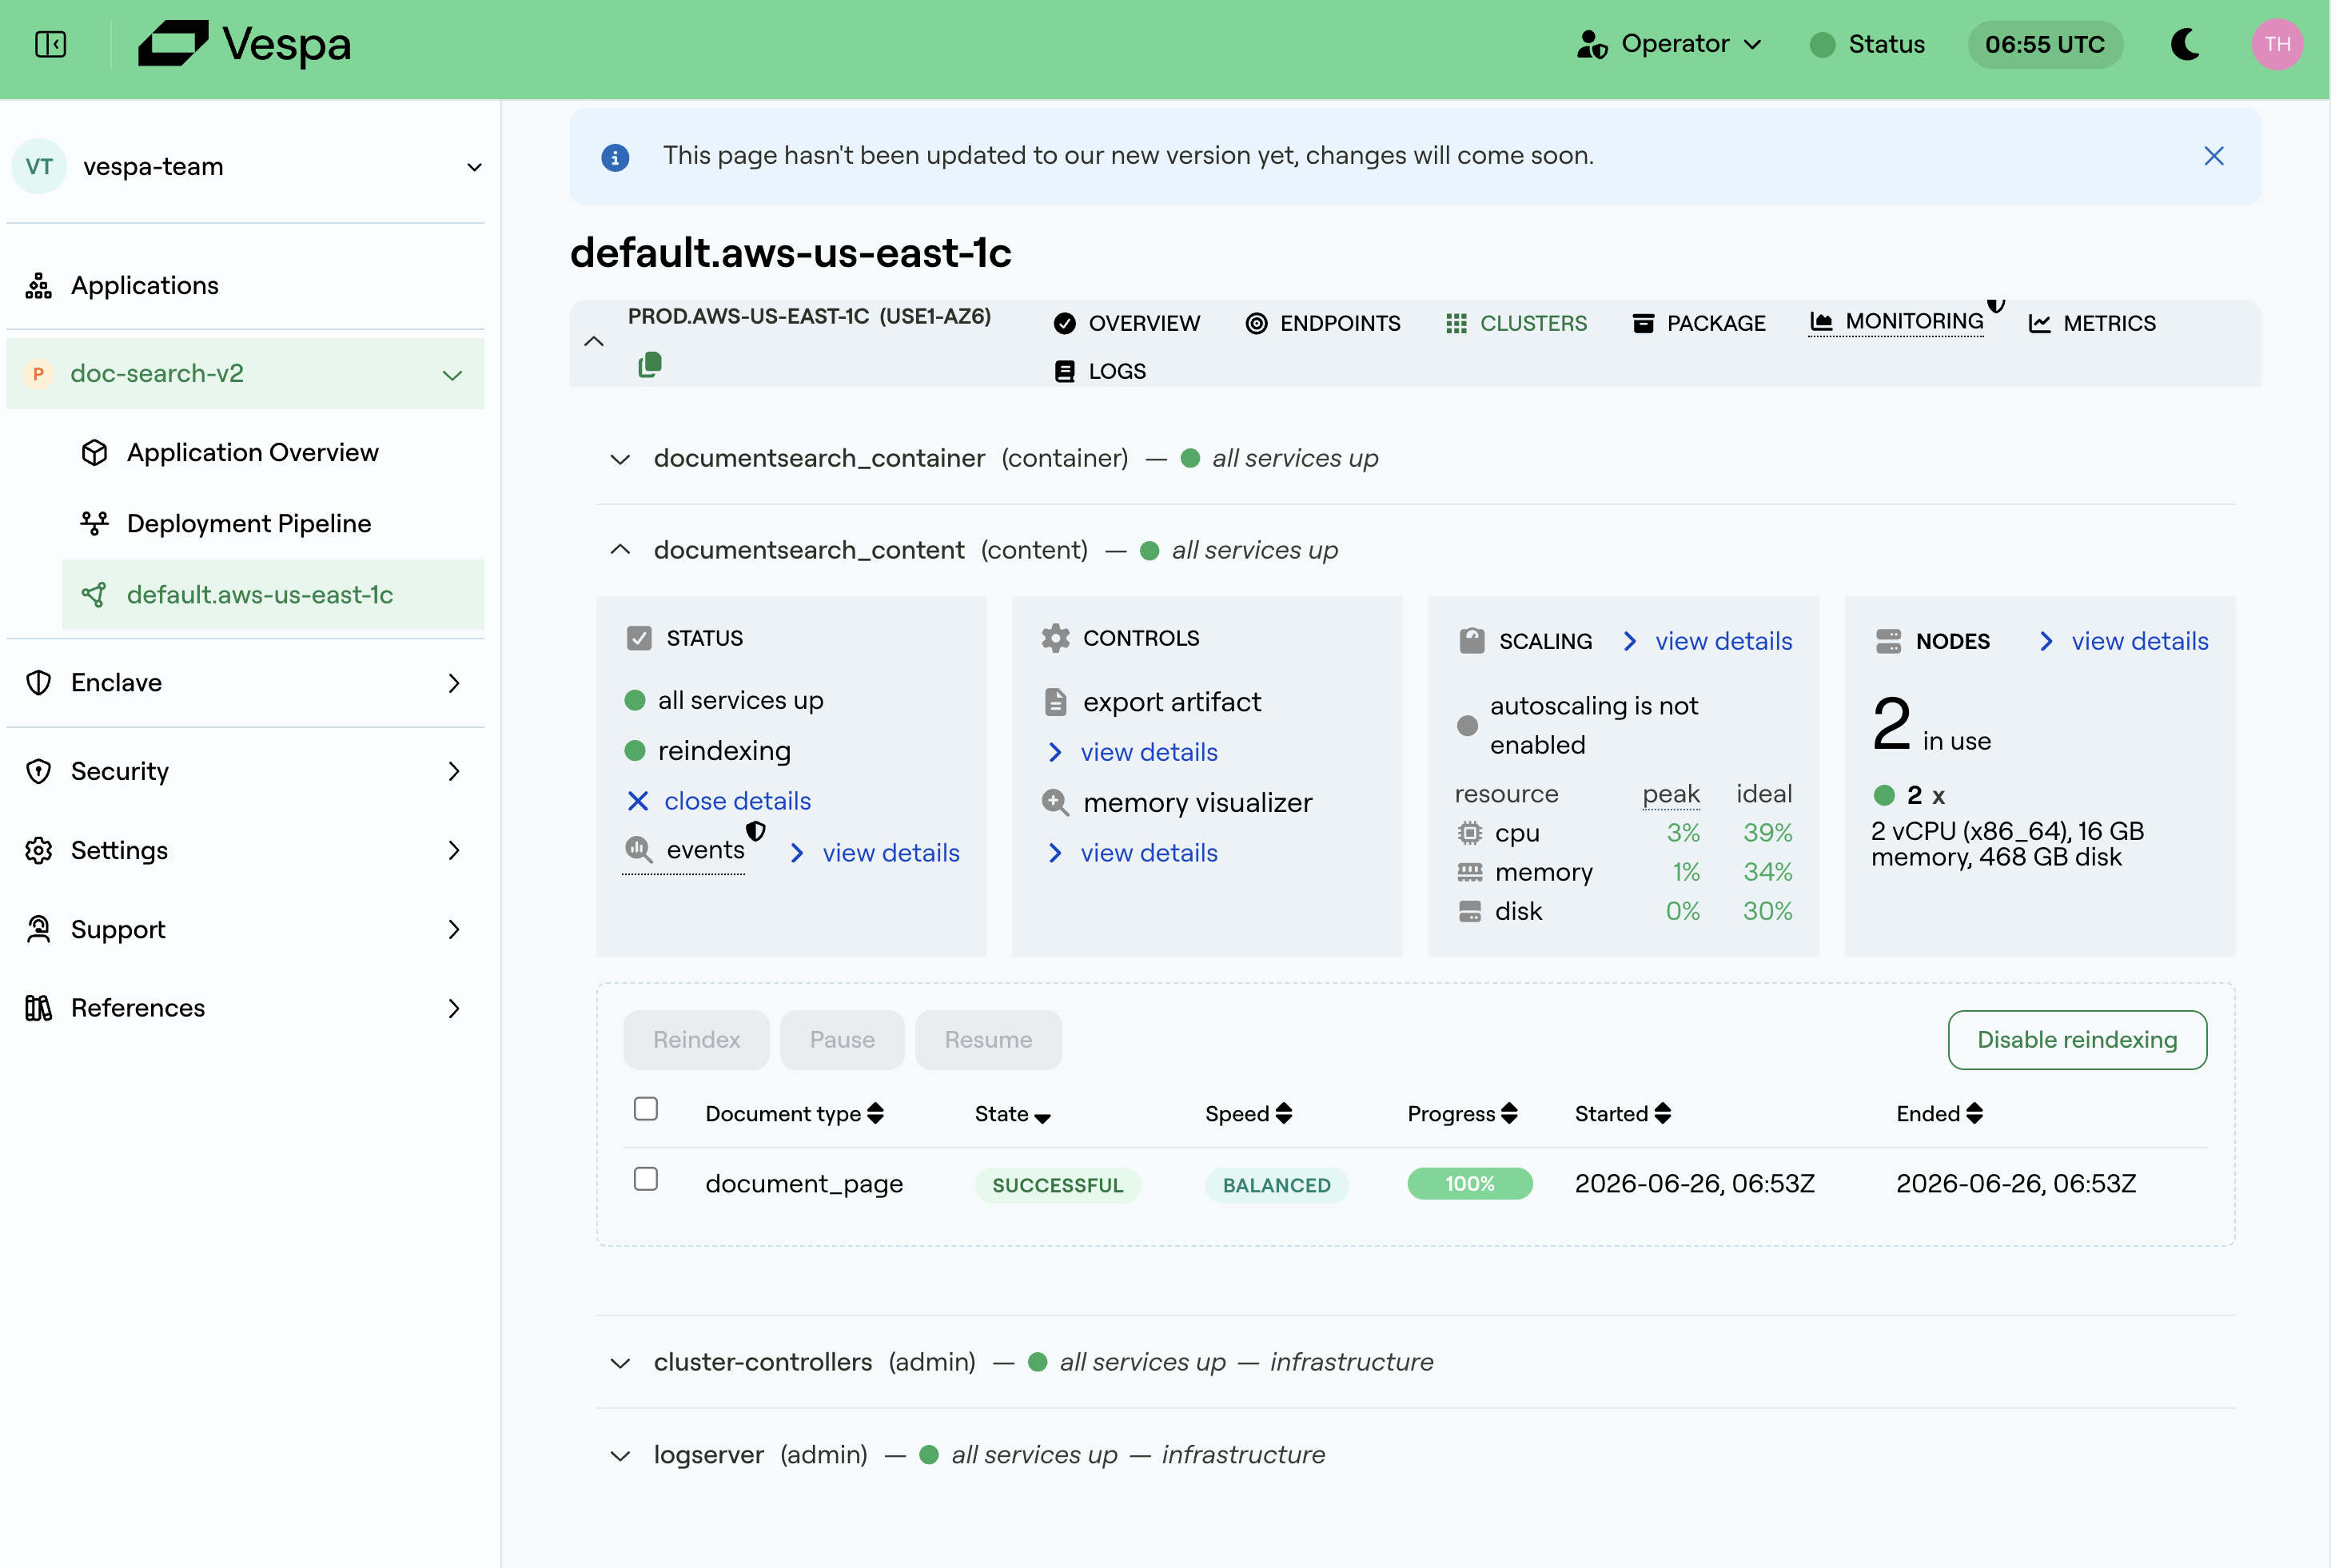
In addition, a running reindexing is shown as a Reindexing annotation on the metric charts. See Monitoring for details. This makes it easy to correlate reindexing with any change in feed or query latency while it runs.
Related
- Reindexing: concepts, states, and schema-change use cases
- Changes that require reindexing
- Monitoring: annotations and metrics
- Reindexing API reference