Vespa CloudThis content is applicable to Vespa Cloud deployments.
Telemetry export
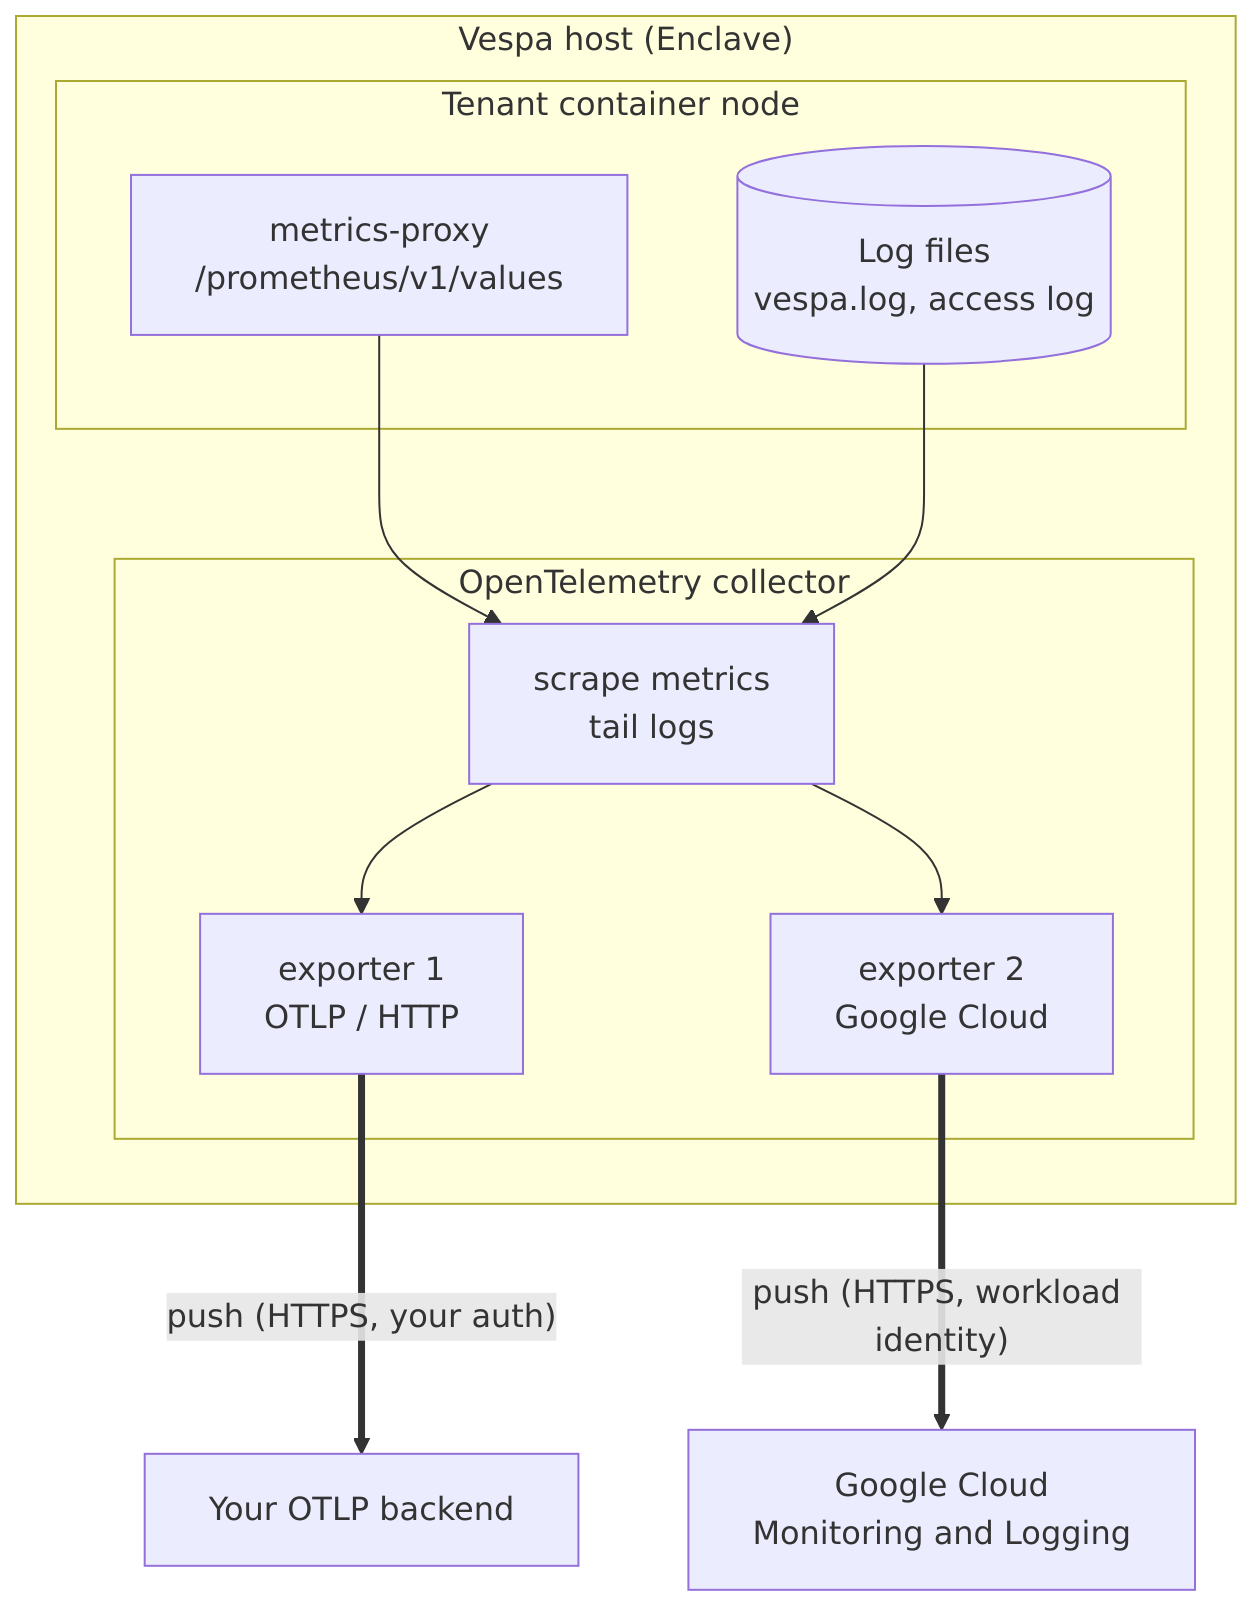
Telemetry export lets you ship your application's metrics and logs from Vespa Cloud directly to your own
observability backend — a fully self-service, push-based alternative to the pull-based
Prometheus metrics API.
You declare one or more exporters in
services.xml; Vespa Cloud then runs a
collector on your hosts that scrapes the selected metrics, tails the selected logs, and pushes them to the
backend(s) you configure, authenticated with credentials from your vault. Configure your vault and secrets
using the Vespa secret store, grant infrastructure access, add
the telemetry exporter configuration, deploy, and telemetry starts flowing in minutes.
An exporter is a single export target: it defines one backend destination, how to authenticate
to it, and which signals (metrics and/or logs) to send there. It is the
exporter concept from the
OpenTelemetry Collector — the component that delivers telemetry to a specific destination. Configure
up to three exporters to fan your telemetry out to multiple backends — each with its
own destination, authentication, metric set, and log selection.
How it works
On deploy, Vespa Cloud provisions and runs a dedicated
OpenTelemetry collector on each of your Enclave hosts
— as of now, Grafana Alloy — running
isolated from Vespa's own observability so a failure in your export pipeline cannot affect your nodes.
For each exporter, the system generates a collector configuration that scrapes the configured metric sets
from the internal Vespa metrics endpoint, tails the selected log files, and enriches each metric point and
log line with labels such as hostname, parent hostname, and zone. The collector then batches the data and
pushes it to your backend over HTTPS.
A metric set is a named selection of Vespa metrics,
and is the unit the collector exports: the OpenTelemetry collector consumes the metric set(s) referenced by
each exporter. To limit or customize which metrics are exported — rather than exporting a predefined
set such as default — define your own metric set and configure the exporter to collect
it.
Authentication tokens for your telemetry backend stay in your
Vespa secret store vault and are referenced from
services.xml by name only — never embedded in the application package. They are resolved
securely and used solely to authenticate the collector to your backend. To enable this, grant
infrastructure access to the vault once for your Enclave cloud account: the collector reads your
secret once to set up the export, so the Vespa infrastructure needs read access to it. This access is given
to the platform's identity, not to people — having access to a host does not let anyone read your
secret. It stays within your own cloud account, is read-only, and is used only to set up the collector, so
your secret is never exposed to others, including Vespa operators.
Labels
Exported metrics and logs are labeled with metadata identifying where they came from, so you can filter and
group them by host, application, zone, cluster, and cloud in your backend.
Metrics carry Vespa's standard metric labels (such as applicationId,
clusterid, clustertype, vespa_service), and the pipeline ensures
these are present:
ai.vespa.instance — the application instance
(<tenant>.<application>.<instance>).
ai.vespa.node — the Vespa node name.
host.name — the host the node runs on.
ai.vespa.cluster — the cluster name.
ai.vespa.cluster_type — the cluster type (container,
content, …).
ai.vespa.group — the content group.
log.file.name — the source log file.
Log lines are additionally parsed into structured fields such as timestamp, level, and component.
Cloud attributes — for both metrics and logs, the collector detects the host's cloud
environment and adds standard cloud.* and host.* resource attributes, such as
cloud.provider, cloud.account.id, cloud.region,
cloud.availability_zone, host.id, and host.type.
Before you begin
Complete the following before configuring telemetry export:
In the Vespa secret store, create a vault and add the
authentication secret(s) your backend requires.
Grant infrastructure access to the vault for your Enclave cloud account, so the Vespa hosts
can read the secret.
Note:
A googlecloud exporter authenticates with the host's workload
identity instead of a vault secret. In your Google Cloud project, enable the Cloud Monitoring and Cloud
Logging APIs, and grant the Enclave host service account the roles/monitoring.metricWriter
(metrics) and roles/logging.logWriter (logs) roles. Without these, the exporter runs but no data
is recorded.
Configuration
Telemetry export is configured under <admin version="4.0"><telemetry> in
services.xml. Each <exporter>
maps to a Grafana Alloy
exporter component and is
configured with the attributes and child elements below. At most three exporters may be configured per
application.
Attribute / element
Required
Description
id
Yes
A unique identifier for the exporter.
type
Yes
The exporter type: otlp, otlphttp, or googlecloud. Determines
the Alloy exporter component the exporter maps to.
endpoint
For otlp / otlphttp
The telemetry backend URL.
project
For googlecloud
The Google Cloud project ID. Not used by otlp / otlphttp.
For otlp / otlphttp exporters whose backend requires authentication, add an
<auth> element with exactly one of the methods below. Each references a
vault and the secret name(s) holding the credential; the secret
values themselves stay in the vault. A googlecloud exporter does not use <auth>.
Method
Attributes
Sends
<bearer-token>
vault, secret-name
Authorization: Bearer <token>
<api-key>
vault, secret-name, header
The secret value in the header named by header.
<basic-auth>
vault, username-secret-name, password-secret-name
An HTTP Basic Authorization header.
Metrics — <metric-set>
Add a <metric-set> for each metric set to export, referenced by id. Use a
predefined set such as default, or a custom set defined as a
metrics consumer. An exporter may reference several
metric sets.
Logs — <logs>
Add a <logs> element containing one or more <type> entries, with
id set to container-logs (the application's Vespa log) and/or
access-logs (the container access log).
By default, each exporter also sends the collector's own self-metrics to your backend, alongside your
application metrics and logs. Use these to observe the export pipeline itself: include whichever are
relevant in your dashboards, and define alerts both on their values and on missing data —
absent self-metrics can indicate the collector is no longer running.
Recommended metrics to consume:
Metric points sent — otelcol_exporter_sent_metric_points_total
Metric points that failed to send — otelcol_exporter_send_failed_metric_points_total
Log records sent — otelcol_exporter_sent_log_records_total
Log records that failed to send — otelcol_exporter_send_failed_log_records_total
Collector CPU and memory usage — alloy_resources_process_cpu_seconds_total,
alloy_resources_process_resident_memory_bytes
Collector start time, to detect restarts —
alloy_resources_process_start_time_seconds
Vespa Cloud also monitors the collector's health and export success on its side and raises alarms on
failures, such as the collector failing to start or persistent export errors.
If a deployment fails, make sure the vault exists and that
infrastructure access to it has been granted for your Enclave cloud account.
Operating the telemetry backend is your responsibility. If the endpoint rejects incoming data or becomes
unavailable, the collector retries and buffers the data for a limited period, so brief interruptions are
tolerated. A prolonged outage, however, exhausts the queue, and the affected telemetry — including the
collector's self-metrics, which are delivered over the same path — is then permanently lost. We
recommend monitoring the endpoint's availability independently and ensuring it remains in a healthy,
operational state to prevent telemetry loss.
Independently of telemetry export, application metrics remain available at all times in the
Vespa Cloud Console, which you can rely on as a fallback should
the export pipeline be unavailable.
Supported signals and limitations
Metrics and logs are supported.
Traces are not supported yet.
Export is customizable by metric set and by log file. Additional customizations and transformations in
the telemetry pipeline are not supported at this time. If you need additional capabilities, let us know
through support.